The Unabara Z-Sweep plugin is a which reads out dual frequency and bottom parameters (optional) from a multi transducer echo sounder system (MTES) and sends this information as raw data to Hydromagic for further processing. The Z-Sweep system is able to handle up to eight transducers simultaneously. The plugin is able to read and store the following data from the echo sounder :
All the above parameters can be stored and processed in the Hydromagic software.
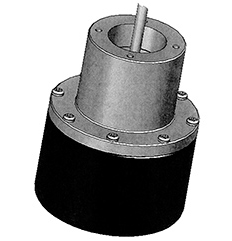
A single BSU unit (below surface unit).
To load this plugin, open the preferences window by selecting "Preferences..." from the "Options" menu. In the window that appears, select the "Devices" tab. Next click the "Add..." button.
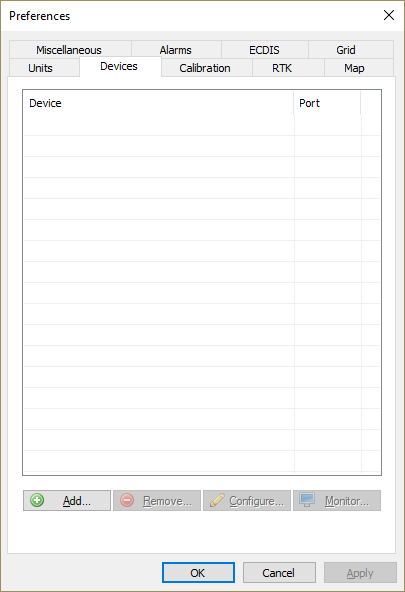
Select the devices tab to add new plugins.
A list of available plugins will be displayed. In this list, select the "Unabara Z-Sweep Plugin for Hydromagic" and click "OK" to load and display the plugin's user interface.
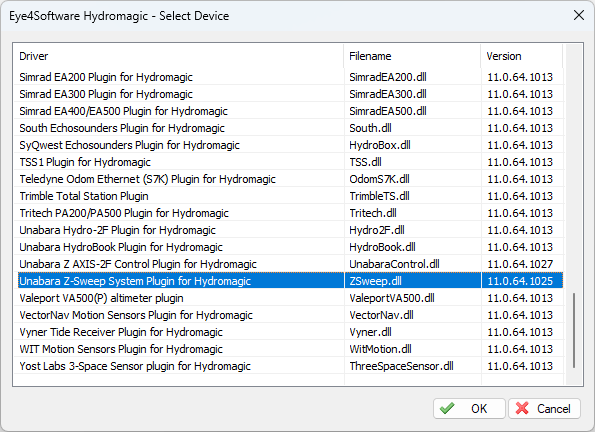
Select the "Z-Sweep" plugin from the list.
When the plugin loads, a dialog with some required settings will appear first. You have to set the communications options, like the serial port and serial speed. Please note that the default serial speed used by the Z-Sweep system is 115200bps. To set an (optional) latency value, click the "Advanced Settings..." button first. In the "Advanced Settings" section, you will also need TCP options, which are used only when you connected your Z-Sweep system via a serial device server in TCP server mode. When you are using an USB-to-Serial adapter cable, the (virtual serial port) will be created once you plugin in the device, so you must connect the USB cable before setting up the plugin.
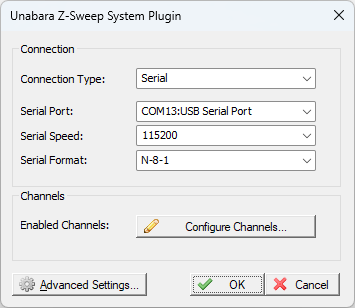
Configure serial port settings first.
To temporary disable one or more transducers, click the "Configure Channels..." button and deselect the check boxes in front of the transducers you want to ignore. To use all transducers connected to the Z-Sweep system, select all the channels in this dialog box.
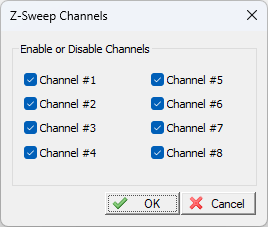
Select which transducers are
included in the data recorded.
When configured correctly, the data send over the serial port should look like this:
ZSWP,1,  5.8,24,  6.3,20,2,  6.1,24,  7.3,20,3,  6.0,24,  6.8,20,4,  6.0,24,  6.7,20,5,  6.1,24,  6.3,20,F,4920
ZSWP,1,  5.8,24,  6.3,20,2,  6.0,24,  7.5,20,3,  6.0,24,  6.8,20,4,  6.0,24,  6.7,20,5,  6.1,24,  6.3,20,F,4920
ZSWP,1,  5.8,24,  6.3,20,2,  6.1,24,  7.5,20,3,  6.0,24,  6.8,20,4,  6.0,24,  6.7,20,5,  6.0,24,  6.3,20,F,4920
ZSWP,1,  5.9,24,  6.3,20,2,  6.2,24,  7.3,20,3,  6.0,24,  6.8,20,4,  6.0,24,  6.7,20,5,  6.1,24,  6.3,20,F,4920
ZSWP,1,  5.9,24,  6.3,20,2,  6.3,24,  7.2,20,3,  6.0,24,  6.8,20,4,  6.0,24,  6.7,20,5,  6.3,24,  6.3,20,F,4920
ZSWP,1,  5.9,24,  6.3,20,2,  6.2,24,  7.5,20,3,  6.0,24,  6.8,20,4,  6.0,24,  6.7,20,5,  6.3,24,  6.3,20,F,4920
ZSWP,1,  5.8,24,  6.3,20,2,  6.2,24,  7.2,20,3,  6.0,24,  6.7,20,4,  6.0,24,  6.7,20,5,  6.3,24,  6.3,20,F,4920
ZSWP,1,  5.8,24,  6.3,20,2,  6.3,24,  6.8,20,3,  6.0,24,  6.7,20,4,  6.0,24,  6.7,20,5,  6.3,24,  6.3,20,F,4920
ZSWP,1,  5.8,24,  6.4,20,2,  6.3,24,  6.9,20,3,  6.0,24,  6.7,20,4,  6.0,24,  6.7,20,5,  6.2,24,  6.3,20,F,4920
ZSWP,1,  5.8,24,  6.4,20,2,  6.3,24,  7.3,20,3,  6.0,24,  6.8,20,4,  6.0,24,  6.7,20,5,  6.1,24,  6.3,20,F,4920
ZSWP,1,  5.8,24,  6.4,20,2,  6.1,24,  7.6,20,3,  6.0,24,  6.8,20,4,  6.0,24,  6.7,20,5,  6.1,24,  6.3,20,F,4920
ZSWP,1,  5.8,24,  6.4,20,2,  6.1,24,  7.4,20,3,  6.0,24,  6.8,20,4,  6.0,24,  6.7,20,5,  6.2,24,  6.3,20,F,4920
ZSWP,1,  5.8,24,  6.3,20,2,  6.2,24,  7.5,20,3,  6.0,24,  6.8,20,4,  6.0,24,  6.7,20,5,  6.3,24,  6.3,20,F,4920
ZSWP,1,  5.8,24,  6.3,20,2,  6.2,24,  7.5,20,3,  6.0,24,  6.8,20,4,  6.0,24,  6.7,20,5,  6.3,24,  6.3,20,F,4920
NOTE: Use the build-in communications monitor in Hydromagic to check!
When the sounder has been connected and configured, click "OK" to store the settings. This will also start the plugin and start reading data from the system. There should be a green icon in front of the plugin name when data is coming in successfully. When the icon turns into a red exclamation mark, it means the serial port selected is already for another plugin, or the port does not exist (anymore).
When data is received, you should be able to see the depth and motion sensor information in the data window. To switch the high and low frequency depth displays between transducers, click the button in the Toolbar (shown below).
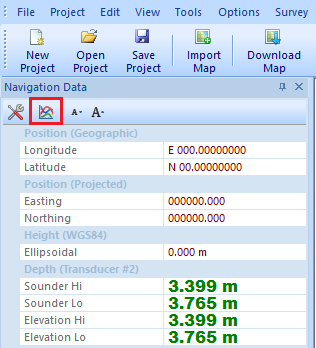
Click the transducer selection button in the toolbar.
After clicking the "Transducer Selection" button in the toolbar for the dataview, all transducers defined in the "Vessel Designer" will be displayed along with their horizontal offset from the vessel's center, as well as their static draft tilt angles (when available). Select the transducer which depth values you would like to see displayed in the dataview, and click "OK" to confirm your choice.
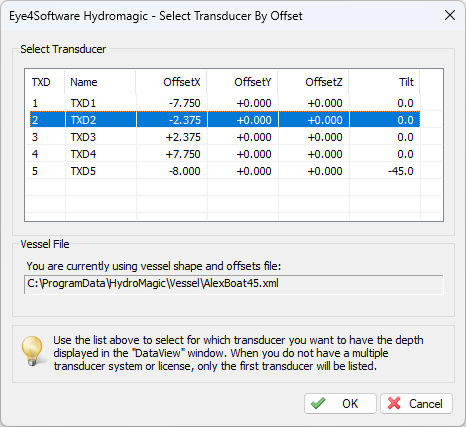
Select the transducer from the list.
To check whether this depth (or range in case of a tilted transducer) information is coming in, create a new project and record some data with this echo sounder. How to setup a project and start recording data is discussed in this manual page.
After recording incoming data for a couple of seconds, depth information already should have been stored in the active raw data file. The currently active raw data file name is displayed in the lower-right corner of the software.
To view the data, locate the active raw data file name in the "Project Explorer", and right click on it to open the context menu.
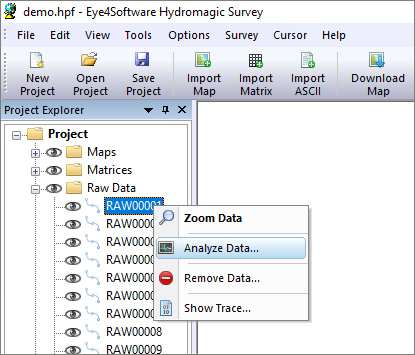
Right click the raw data file to open the data analyzer.
In the context menu that appears, select the "Analyze Data..." option.
Click the "Next Data" button once to advance to the next page of data where the multi transducer echo sounder information is displayed:
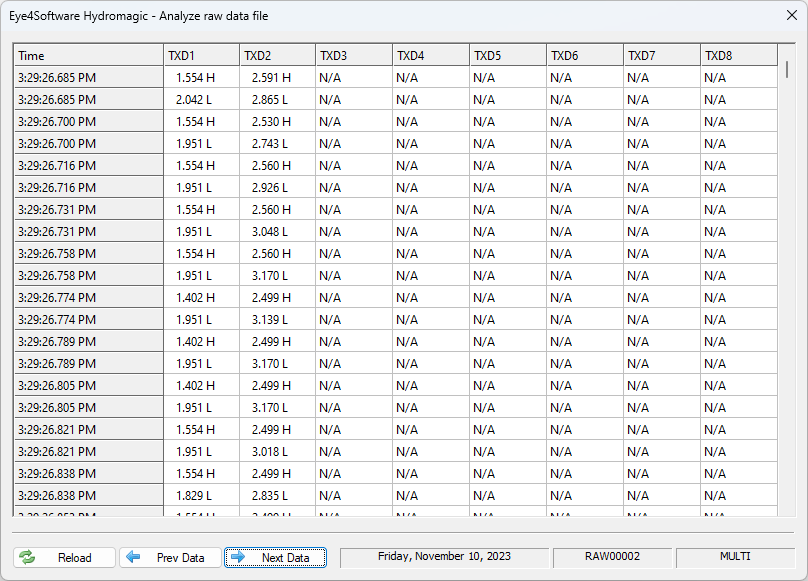
Example of multi transducer depth records (two channels active - dual frequency - TXD2 tilted).