In Hydromagic, a matrix is a collection of regularly spaced depths, which can be projected over the map as color or text. Such data is also referred to as a digital terrain model or DTM. A matrix can be used to view a 3D model of the terrain using the "3D Terrain Viewer", in volume calculations or to generate depth contours.
During the generation of a matrix from a sounding, the scattered data points are converted to regularly spaced data using a TIN (Triangulated Irregularly Network). This TIN is generated using a Delaunay triangulation algorithm. All new data points are generated by "filling" the triangles, which have been formed from the scattered data. The image below shows a color matrix which has been generated using TIN (data points at 0.25 meter interval).
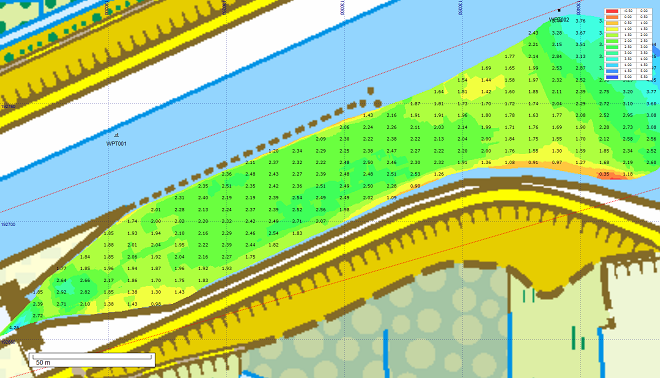
Example matrix generated from sounding and boundary data.
To generate a matrix, you must have a either a valid sounding or a shoreline containing depth information loaded into your project. Without the sounding or shoreline data it is not possible to generate a matrix. Use the "Generate sounding wizard" to generate sounding(s) from your raw data file(s) first.
In order to generate the matrix, you have to specify some settings, like the data being used to generate the matrix, as well as some output options. To do so, open the "Generate Matrix" dialog by selecting rthe "Generate Matrix..." option from the "Tools" menu:
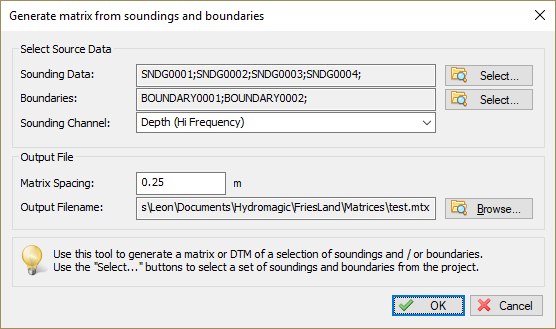
Use the "Generate Matrix" utility to generate a matrix by using a TIN algorithm.
Select from which sounding(s) you wish to generate the matrix. By clicking the "Select..." button, you will be able to select one or more soundings that will be used to calculate the triangulation from which the matrix or digital terrain model will be generated.
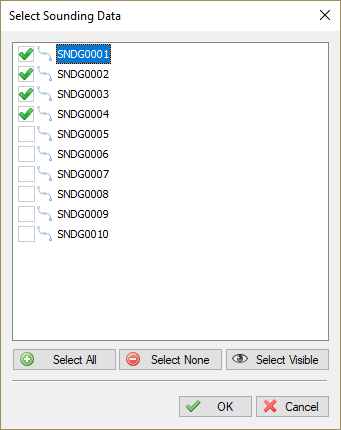
Select which sounding(s) to include in the
matrix generation by checking boxes.
In Hydromagic, boundaries can be used do define a shoreline, a clipping area or an island. When a boundary is defined as a shoreline, including the boundary will automatically include the data points defined on this line.
When an island or clipping boundary is selected, it will be used to determine which area's should be filled with data and which are not. This can be used in cases when only a part of the sounding areas has to be interpolated. When no boundary has been selected, the data points of the selected soundings will be used to determine the area that needs to be filed with data.
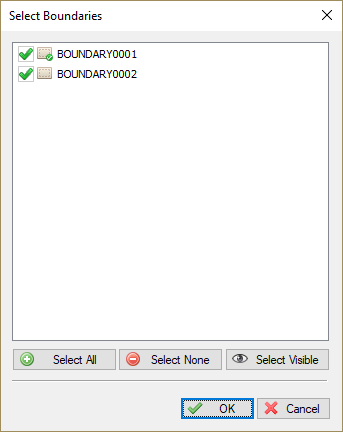
Select which boundaries to include in the
matrix generation by checking boxes.
You can use this setting to select which data of the sounding is used to generate the matrix. This can be one of the following values:
When soundings contain tide information, the "Elevation (Hi Frequency)" option will be selected by default. If you want to generate the matrix using the corrected depth values, without tide correction, select the "Depth (Hi Frequency)" option instead. When the selected soundings don't contain tide information, the "Depth (Hi Frequency)" is selected by default.
Please note that information on bottom loss, reflection, density and porosity will only be available on certain types of echo sounders. The sensor data channels can be used to store for instance magnetometer or temperature data.
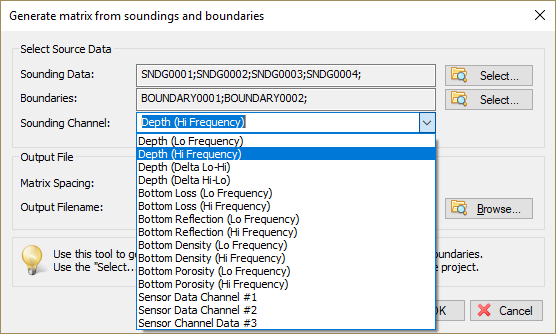
Select the data source for the matrix cells from the drop down selection.
You can select the spacing of the regularly spaced data here. The same spacing is applied to both the X and Y axis. The spacing has to be entered in the same units as used for the map projection.
Which spacing to use, depends on the zoom scale you are using. For an overview of a large area, you can use 2.5 meter. When zooming in on a smaller area, the best is to use values between 0.25 and 1.00 meter.
Please note that when using a larger spacing, it will be generated and displayed faster then a more dense matrix.
Enter the name of the file that is generated here. This setting is required. Use the browse button to select the output folder and file name. The data will be added to the current project and stored in a separate ASCII XYZ file at the desired location.
Finally, click the "OK" button to start the process. It should take a couple of seconds, you can watch the progress in the status bar of the main window.
After generation, you will notice the matrix has been added to the project. Depending on the configuration, the newly generated matrix will be drawn over the map.
There are more ways of showing the matrix on the map. In the example near the top of this page, it is displayed at both colors and text at a 5x5 meter interval. It is also possible to not show it (and just use the matrix to export data), to show it with colors only (using the defined color ranges) or to show its depths as text.
To change settings on how the matrix is shown,right click the "Matrices" folder in the "Project Explorer", and select the "Display Options..." option from the popup menu. A dialog with all matrix settings will be displayed. It should look like the screen shot below:
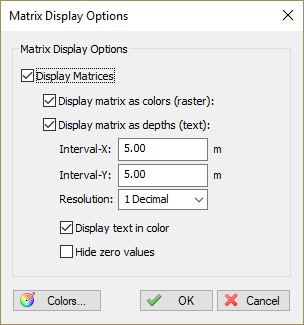
The matrix display can be customized.
The first section is to enable or disable the color overlay, and to specify which colors to use for the different depths. When checking the "Display matrix as colors" option, the matrix is displayed as colors on the map. The "Colors..." button will also be enabled, so you can start creating the color ranges for your sounding.
After clicking the "Colors..." button, the following dialog will appear:
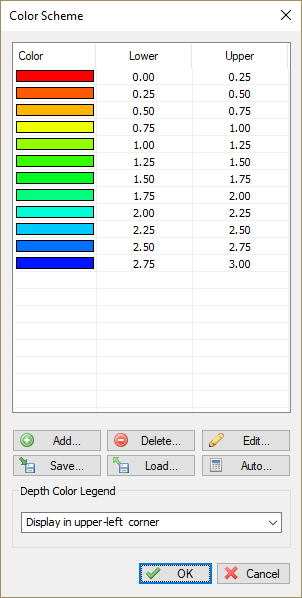
In this dialog, you will be able to add, remove or modify color ranges by clicking one of the buttons at the bottom of the list. To change a range, just double click on it, and change the settings.
In case you want to store the color scheme you designed for other projects, you can store it in a separate XML file using the "Save..." button. Just use the "Load..." button in the other project to retrieve this scheme.
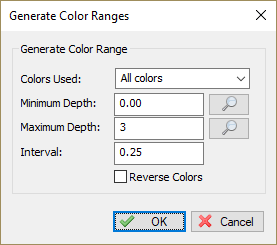
It is also possible to create a color scheme using a min, max and step value. To do so, select the "Auto..." button, and select the lower and upper range, next specify the interval between the ranges.
This tool will generate max 30 ranges, so it is important to choose the correct interval.
You can click the magnifier glass buttons to detect the minimum and maximum values used in all the generated soundings together.
The color dialog also contains the settings for the color legend which can be displayed as a map overlay when colors are displayed. You can turn it on or off here, and select the location where it is displayed.
Using the "Display matrix as depths" check box you can enable and disable depths in text. Depending on the size of the spacing used to generate the matrix, you have to adjust the text intervals in a way that the text's on the map do not intersect.
This video tutorial shows how to generate a matrix from sounding(s) and shoreline(s).