After a sounding has been completed, it is possible to export both the background map (vector maps only),
and the regularly spaced soundings (matrix) to an AutoCAD DXF file for further processing.
In addition to these objects, you can also create an export of the side views of a channel, also called cross sections.
The software will export all generated cross sections to a single DXF file.
These cross sections can then be modified and plotted, or copied to another DXF file, for instance the exported DXF matrices.
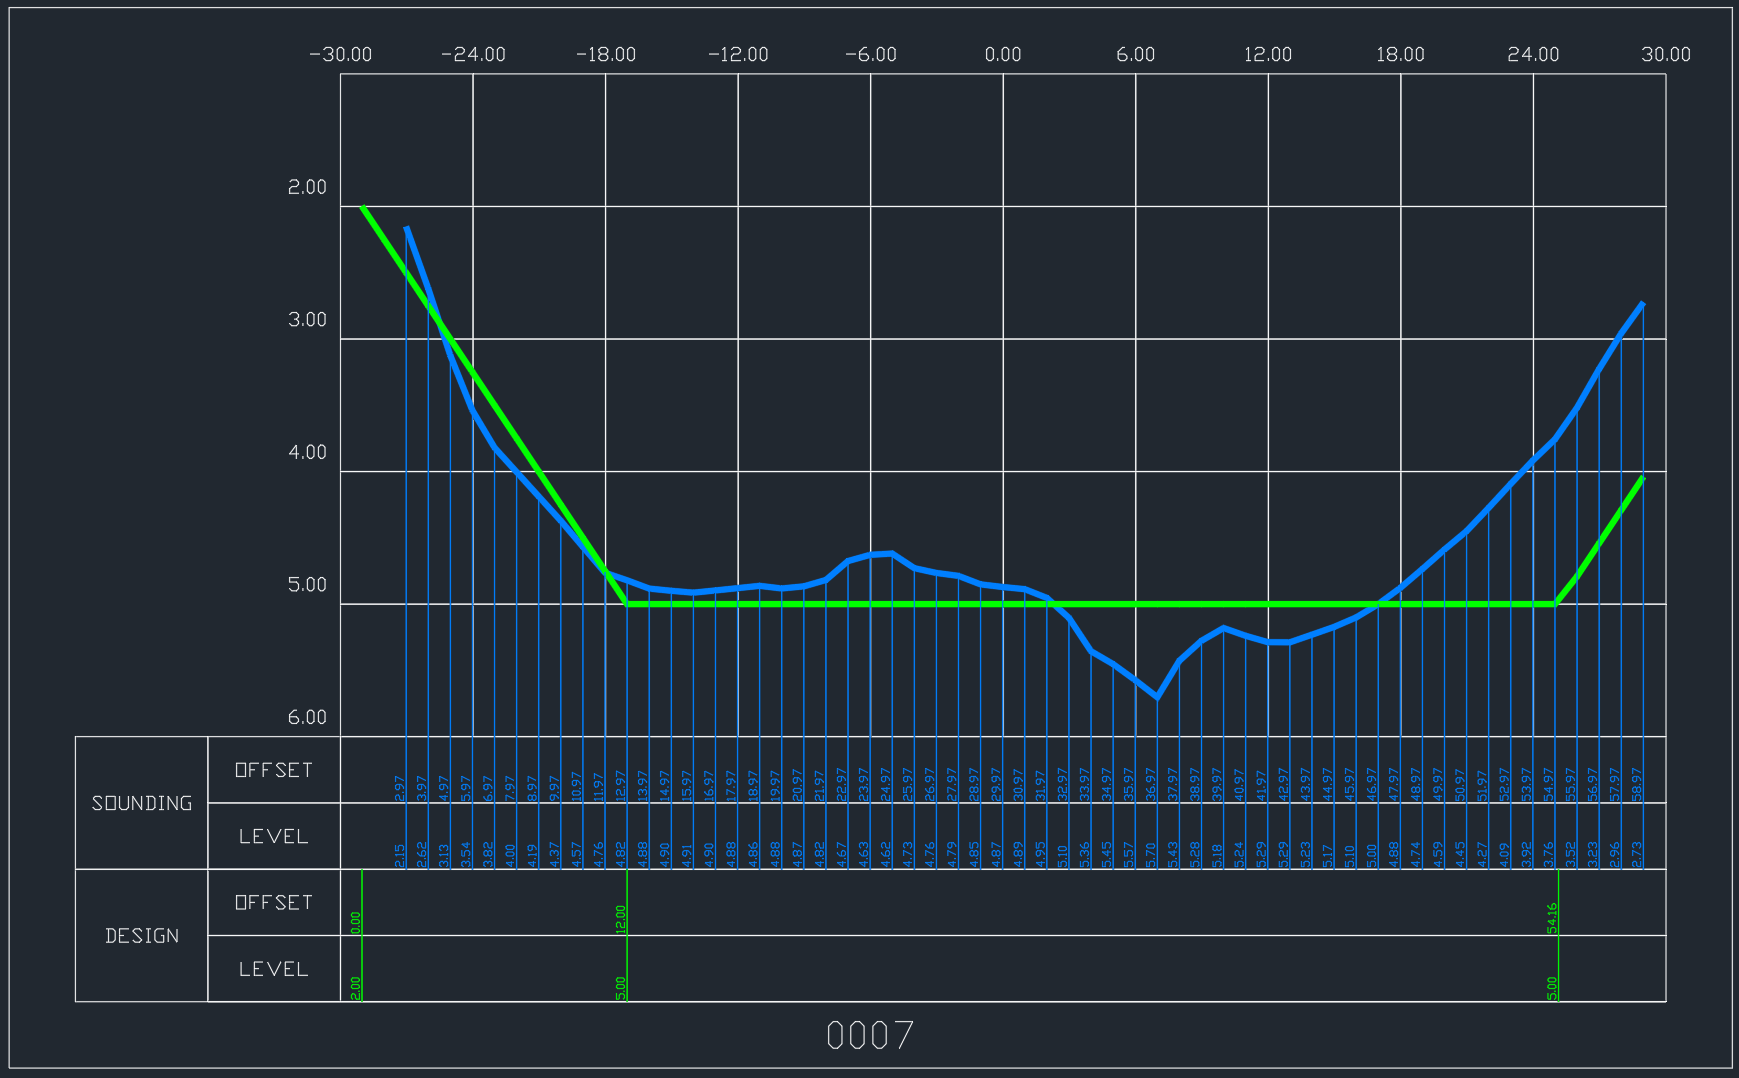
Example of an exported file in AutoCAD 2020
In order to generate cross sections, you have to set the locations of the cross sections. There are various ways to do this:
You can generate the cross sections from the cross sections volume calculation tool in Hydromagic.
To start the matrix volume calculation tool, select the "Volumes (Sections)" option from the "Tools" menu.
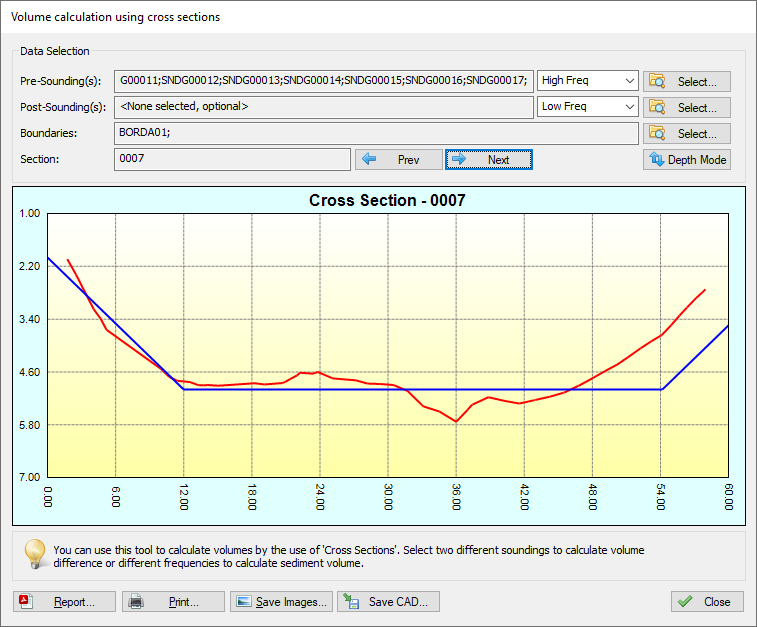
The following dialog will be shown:
Which data has to be selected depends on how to use the tool.
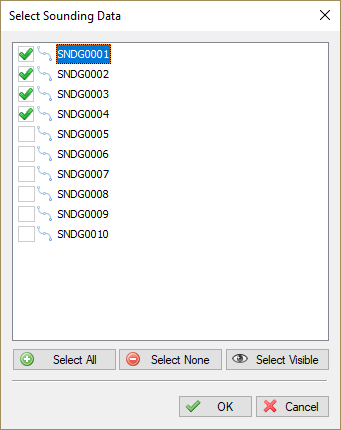
Use the pre- and post soundings to select the soundings to use in the calculation.
When you want to calculate the amount of sediment, you select the same sounding in both input boxes, and select different frequencies.
In case you end up with negative values, just swap the selected frequencies or the values selected in the "Pre-Sounding(s)" and "Post-Sounding(s)" fields.
For dredging volumes, select the soundings created before the dredging operations in the "Pre-Sounding(s)" field,
and the soundings created after the dredging operations in the "Post-Sounding(s)" field.
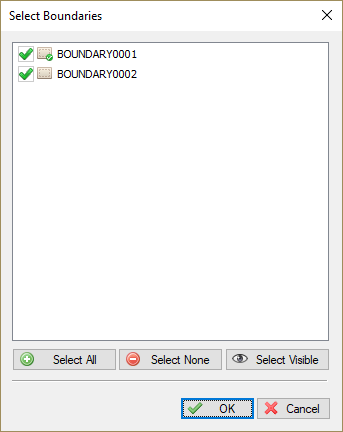
The use of shorelines is optional. The same shorelines will be used for the pre- and post soundings.
When the data has been loaded, you can check the result in the graph by using the "Prev" and "Next" buttons.
When "NO DATA" is displayed in the graph, it means that there are no soundings or shorelines near the cross section.
The pre sounding will be displayed in red, the post sounding in green, while the channel design is displayed in blue.
You can click the "Depth Mode" button to switch between depth and elevation.
When all sections are displaying correctly, you are ready to export the data as AutoCAD DXF file.
When everything has been setup correctly (included soundings and boundaries), you can export the cross sections data as CAD format.
To do so, just click the "Save CAD" button and supply a valid DXF file name.
A popup will be shown whether the export was successfull. The DXF file can be opened in AutoCAD or other CAD programs supporting the DXF file format.
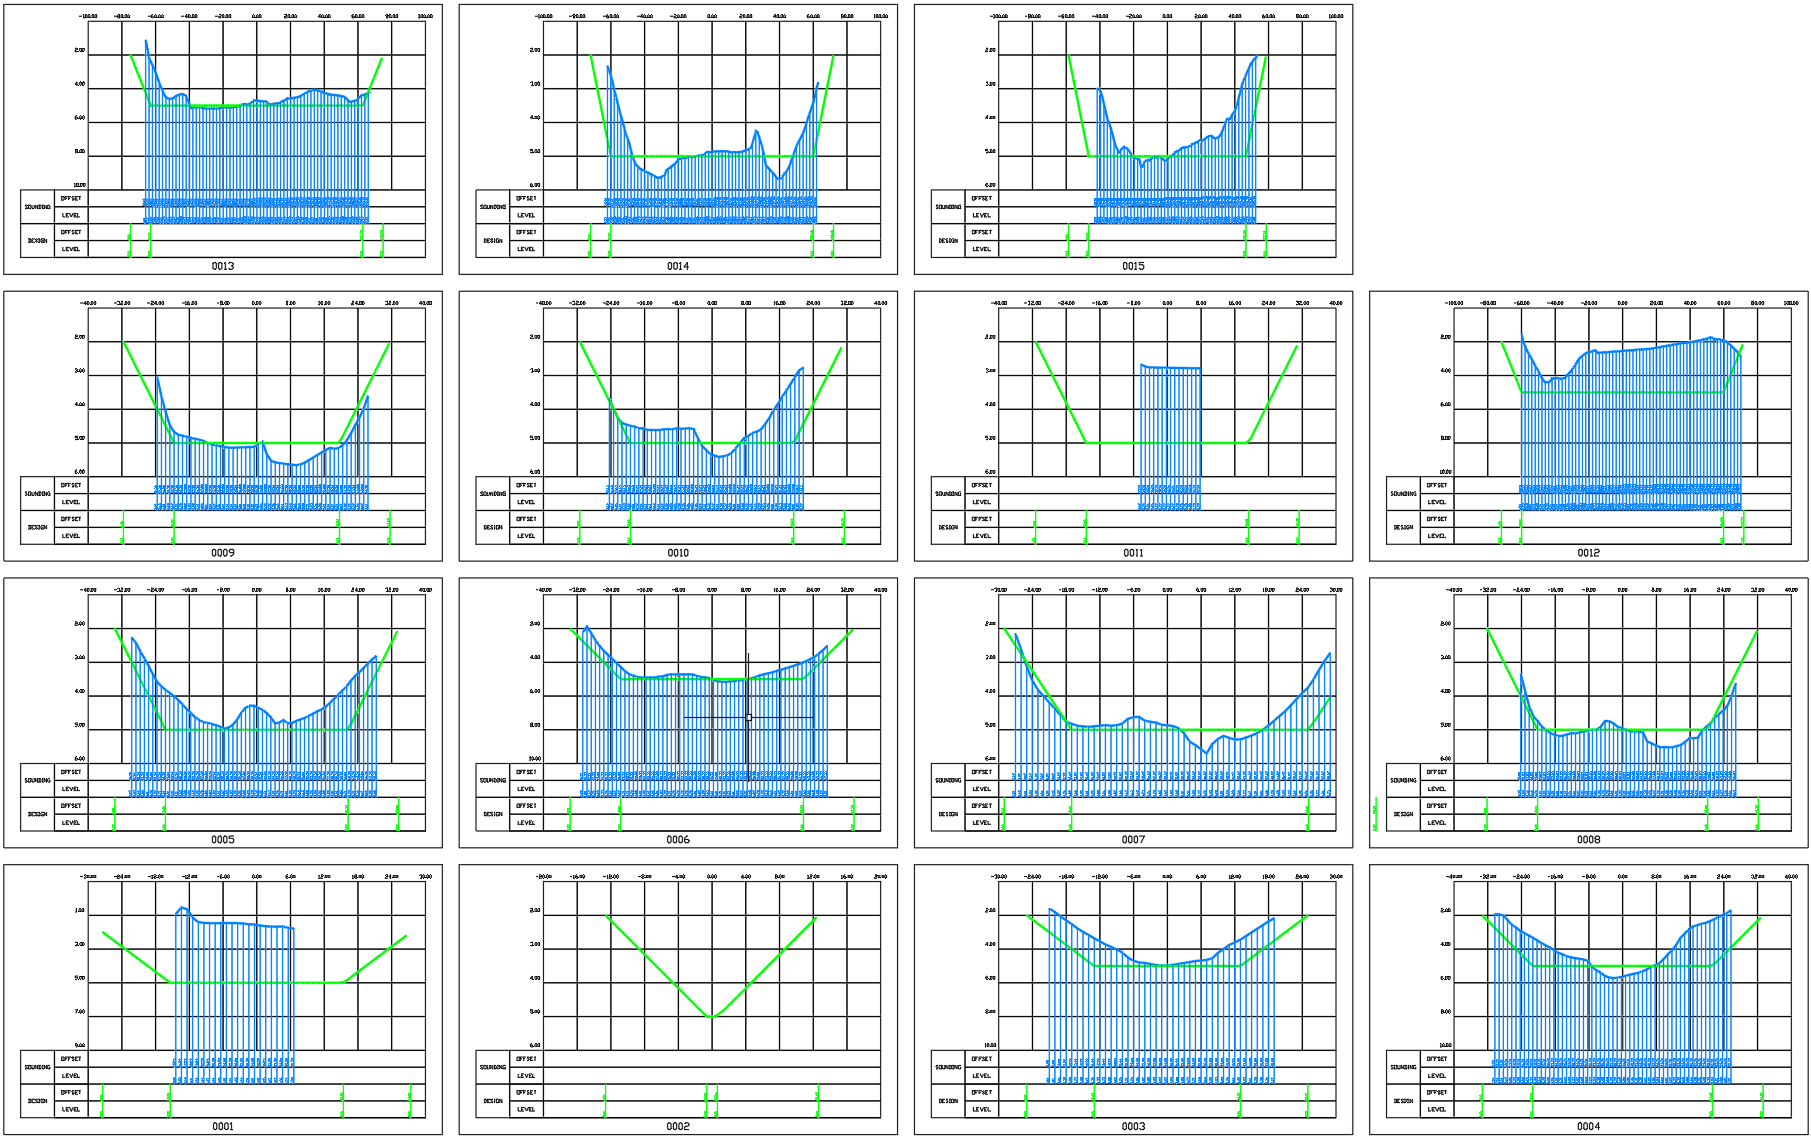
Layout of the exported file in AutoCAD 2020