In Hydromagic all data coming in from devices (using plugins) is recorded into ASCII formatted, human readable raw data files. When performing a survey you might want to start with a single run and check your raw data first before collecting the rest of your data.
You can have a preview of the collected data using the data analysis window. When your sounder is capable of recording the full echogram envelope (which is recorded as binary data for performance reasons), you might want to use the "Echogram Digitizer" tool to check this data as well.
The data analysis window does not have much more functionality then grouping data in separate tables. Data is displayed in a spreadsheet view and is provided with timestamps indicating the exact time the data was received and stored (with one millisecond resolution).
To open a raw data file, to view its contents, locate the file by expanding the 'Raw Data' folder in the 'Project Explorer' which should normally reside on the left part of the screen. Right-click the raw data file you want to analyze and select the 'Analyze Data...' option from the pop-up menu that appears at the mouse cursor location.
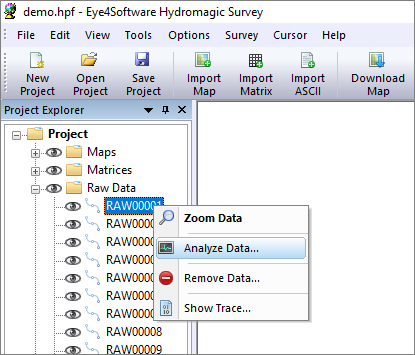
Right click the raw file and select 'Analyze Data...' to view its contents.
After starting the window, it first shows the collected echo sounder depth values. Please note that Hydromagic adds transducer draft before writing depths to the raw data file. This means that the depths reported should be equal to the depth below the transducer with the static draft added to this value.
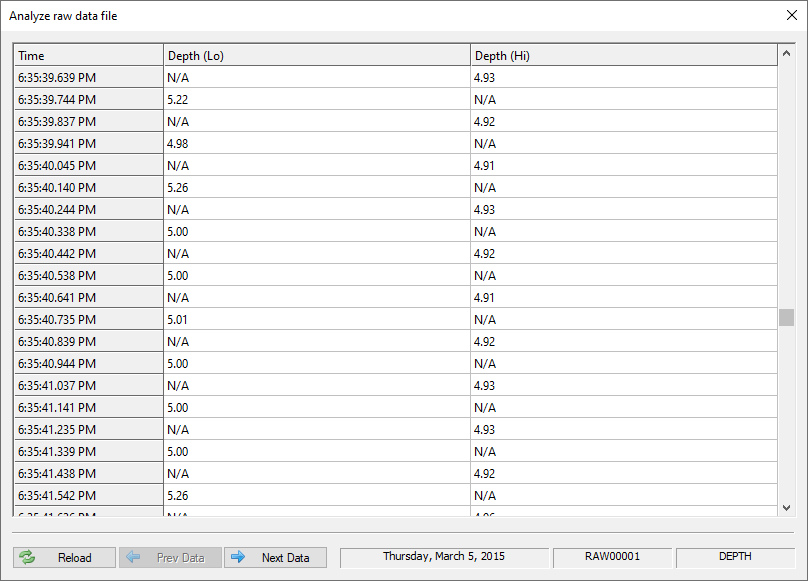
Depth values recorded with a dual frequency echo sounder.
Please note, that when using a single frequency echo sounder, the low frequency column will contain only 'N/A' values.
At the bottom of the screen the name of the raw data file, raw data type as well as the recording date are displayed. To select other data to display, just click the 'Prev Data' and 'Next Data' buttons.
The second page which comes after the page containing the depth values contains bottom parameters. These parameters are recorded only by a couple of echo sounders, so you might notice that this screen might contain no values.

Bottom information values recorded with an Unabara Hydro-2F echo sounder.
Although this page isn't used by most customers, we decide it to place it directly after the depth page because it is related to echo sounder information. Parameters that will be displayed here when available include:
The third page contains position information as recorded by your GNSS/RTK receiver or total station. When using RTK tides, you should have a valid Ellipsoid height value in the third column. If this field is empty or intermittent, please check your GPS configuration as your receiver is sending out incorrect, too less or redundant NMEA0183 sentences.
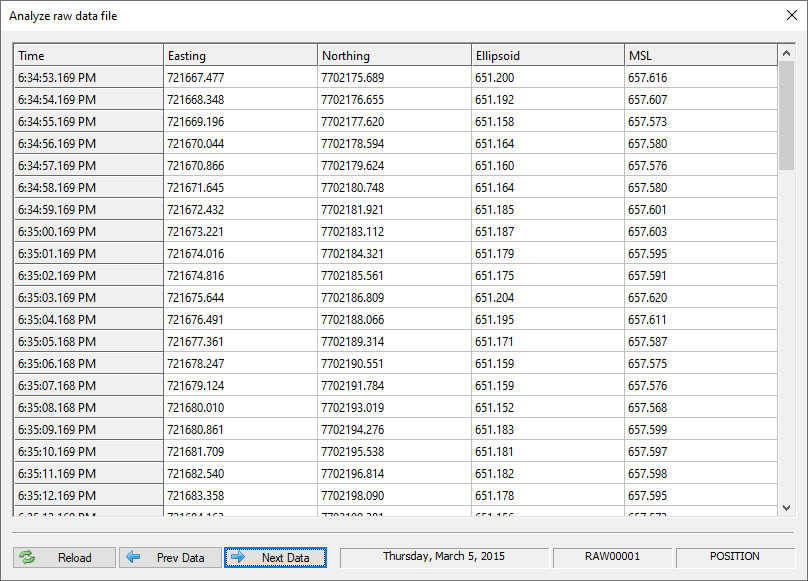
Position information containing height information recorded at 1Hz intervals.
The first two columns contain the position information like projected eastings and northings. Please note that your raw data file contains geographic WGS84 positions as well. These are not displayed since they are only used when reprojecting or importing the raw data file. Make sure that you have a valid position in this table with an update rate of at least once per second.
Heading information is required only when your echo sounder transducer is not at the exact horizontal position as your GPS antenna. In this case it has to be present to be able to calculate the position offset between the two sensors.
The first column shows true heading, which is in most times calculated by the GPS (only when moving ) and send to the software using the VTG NMEA0183 sentence. When the second column is used, the heading is a magnetic heading provided by a (flux)compass, gyro or IMU.
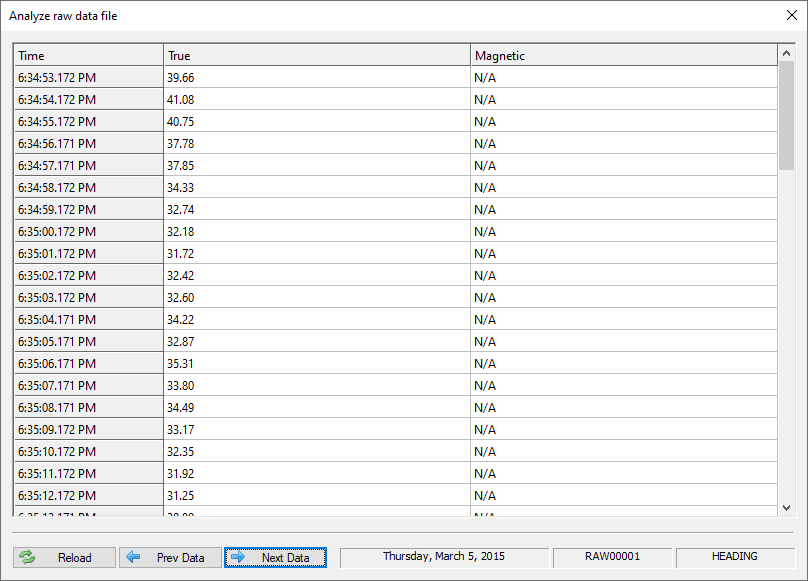
True heading information recorded at 1Hz intervals.
When both true and magnetic heading are stored, you can instruct Hydromagic which one to use by selecting either true or magnetic heading under the 'Calibration' tab in the preferences screen.
When processing Hydromagic raw data files, speed is not used. It is however recorded to be able to check the speed the data was recorded on, and for future purposes (for instance the ability to calculate missing position data points by using speed and course). Speed is normally reported by the GPS receiver.
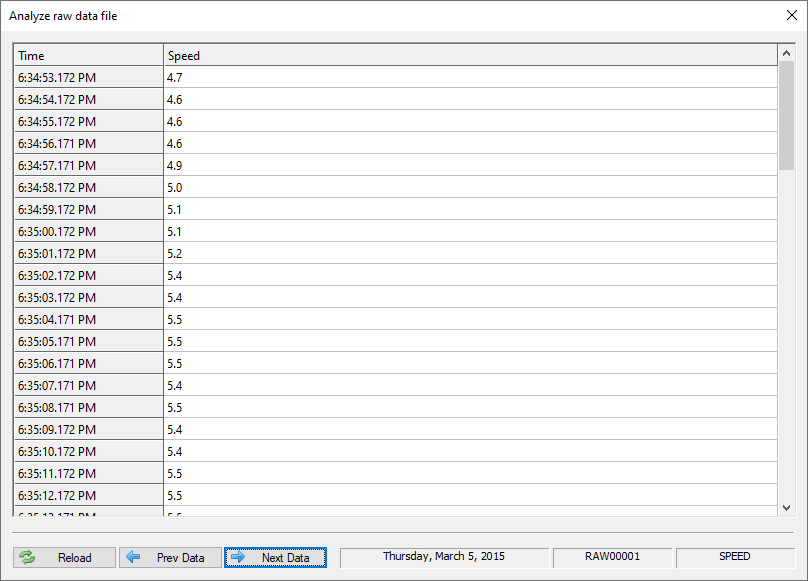
Speed information recorded at 1Hz intervals.
When using RTK to calculate tide levels, make sure that all GPS quality records have the 'RTK FIX' status before proceeding with your survey. When it switches between RTK FIX, RTK FLOAT and AUTO, it is possible that your radio link or cellular signal is lost sometimes, and you might want to fix this issue first.
This table also contains information on the number of satellites used in the position calculation, the differential beacon id used (for instance WAAS, EGNOS or LF Beacon) and the age of the correction data (in seconds). To have a look at the DOP data, you have to proceed to the next page by clicking the 'Next Data' button.

Check the GPS quality data for the fix status, especially when using RTK tides.
DOP stands for Dilution Of Precision and is reported by a GNSS receiver to specify error propagation as a mathematical effect of navigation satellite geometry on positional measurement precision. Hydromagic stores three types of DOP values:
These three values are stored in the raw data file in order to have the ability to filter out erroneous position records during data processing.
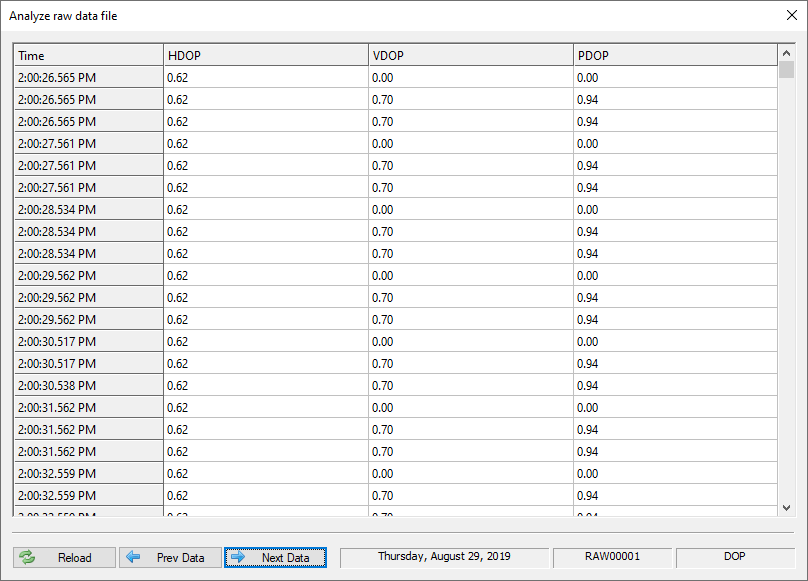
Dilution Of Precision for the reported GPS position.
The horizontal dilution of precision is reported by the 'GGA' NMEA0183 sentence while all three sentences are reported by the 'GSA' sentence. This explains why there are sometimes records without the VDOP/PDOP values in the example above (the records generated from the GGA sentence).
Tide levels are in most cases calculated from the antenna elevation of a RTK receiver by using a fixed offset and geoid model. When RTK tide is used, tide values are not stored inside the raw data file since they are calculated and applied when converting raw data to soundings.
When you have connected a tide receiver, or when you use the manual tide plugin to adjust the tide level manually during the survey, these values are written to the raw data file and will be displayed in the tide data table.
A motion sensor can be used to compensate for the motion of the vessel during the survey. The depth and position will be adjusted by using the heave, pitch and roll values received from the motion sensor during post processing. Use this page to check the values sent by the motion sensor. Please note that some sensors only provide pitch and roll without heave.
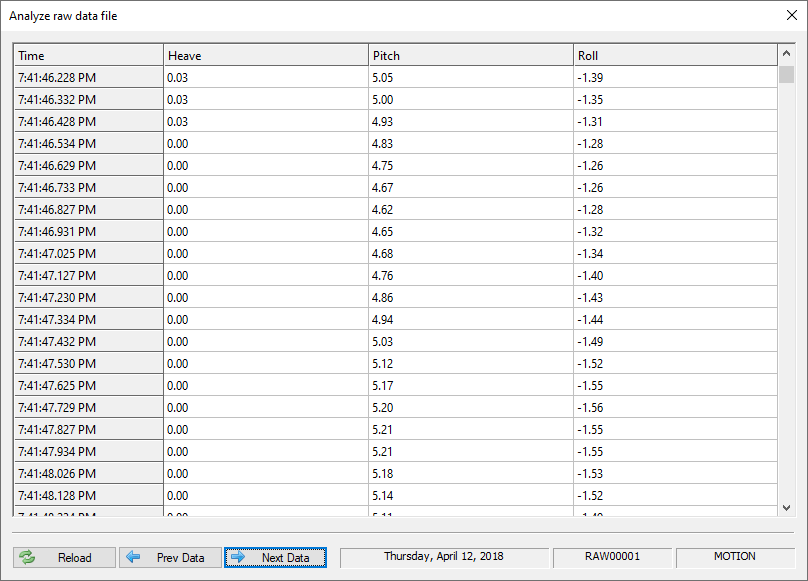
Heave, pitch and roll data reported by a motion sensor.
By default echo sounders calculate the depth by using a speed of sound of 1500 meters per second. In some cases, for instance at sea with salt water this value may differ. This can be corrected afterwards during post processing by using the sound velocity editor.
When connecting a sound velocity profiler or by using the Hydromagic Manual Sound Velocity plugin sound velocity corrections are stored into the raw data file. Sound velocity correction data collected during the survey will be displayed in this table.
During a survey you can press the 'F8' key to store events or annotation marks in the raw data file. The purpose is to mark a special position on the map or echogram data.
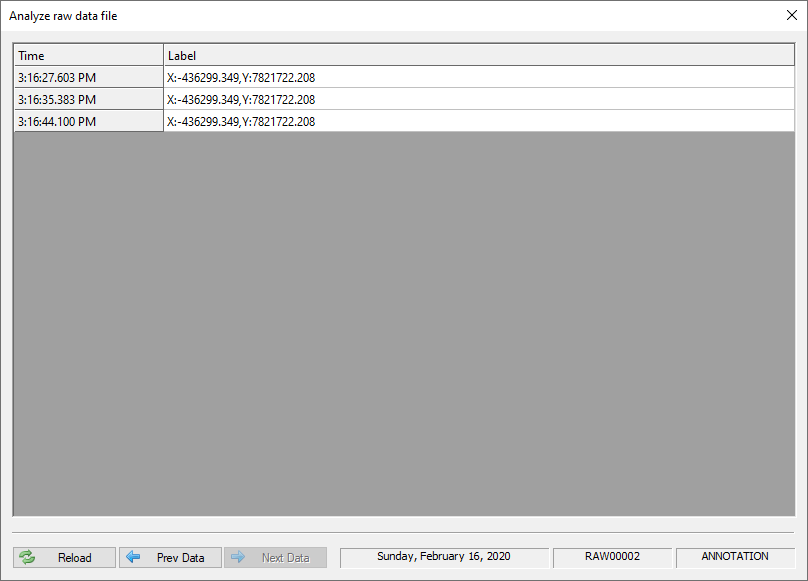
Annotation marks inserted into the echogram by the user.
Depending on the format defined for the annotation marks, an event with or without label is inserted into the data. This table shows the times and labels for the annotation marks inserted.